
Scientific Visualization
| Resume |
| Animation |
| Graphics |
| PC Scientific Visualization |
| Multimedia |
| Visualization |
| Supercomputing |
| Video Productions |
| Back to the Future |
|
Scientific
Visualization
|
|
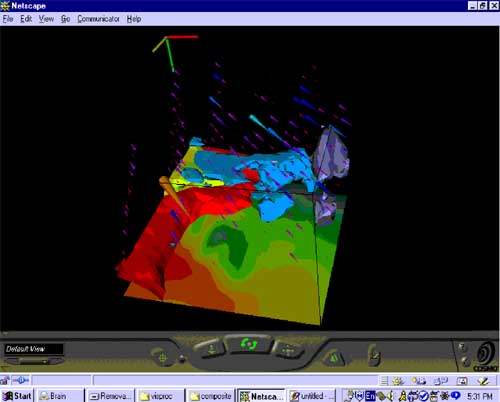
| This picture shows a stereo-pair of the globe. The green areas depict land, and the black areas depict ocean. The pink areas represent two iso-surfaces of extremely high temperature zones in the Sahara Desert and the Persian Gulf States. |  |
If this picture is viewed with a stereographic device, the iso-surfaces can be realized as three-dimensional objects. The data of this picture were created by a climate simulation model, Community Climate Model (CCM) of the National Center for Atmospheric Research (NCAR). The data were generated on a Fujitsu supercomputer VPX 200. NASA's visualization software system FAST was used to generate this stereo-pair. The workstation used was an SGI Onyx.
 Today,
a similar simulation can be done with a high performance workstation,
and visualization can be done with a power PC. A
paper is published to demonstration that a PC with a public domain
software can achieve good quality scientific visualization materials.
Today,
a similar simulation can be done with a high performance workstation,
and visualization can be done with a power PC. A
paper is published to demonstration that a PC with a public domain
software can achieve good quality scientific visualization materials.