Introduction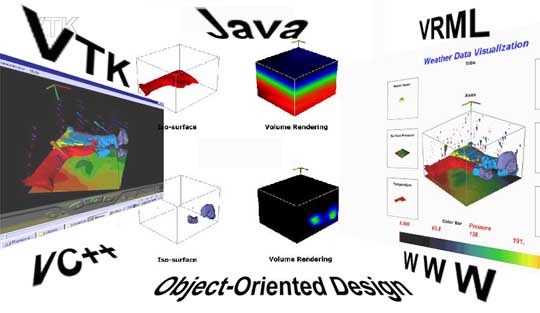
I started my career as a research scientist. I used computers as a tool to understand the cloud formation. Gradually, I grew fond of computers that I worked on, and I gradually transform myself from a tool user to a tool developer. My scientific background helps me to design a tool or a system with logic and rules. My engineering practice helps me to design a practical system.
Here is an example how my science and engineering backgrounds work together. I developed a personal computer based data visualization system, and this system is used to analyze weather data.
|
||
ABSTRACT The current research will investigate the possibility of developing a computing-visualization system using a public domain software system built on a personal computer. Visualization Toolkit (VTK) is available on UNIX and PC platforms. VTK uses C++ to build an executable. It has abundant programming classes/objects that are contained in the system library. Users can also develop their own classes/objects in addition to those existing in the class library. Users can develop applications with any of the C++, Tcl/Tk, and JAVA environments. The present research will show how a data visualization system can be developed with VTK running on a personal computer. The topics will include: execution efficiency; visual object quality; availability of the user interface design; and exploring the feasibility of the VTK-based World Wide Web data visualization system. The present research will feature a case study showing how to use VTK to visualize meteorological data with techniques including, iso-surface, volume rendering, vector display, and composite analysis. The study also shows how the VTK outline, axes, and two-dimensional annotation text and title are enhancing the data presentation. The present research will also demonstrate how VTK works in an internet environment while accessing an executable with a JAVA application program in a webpage. Keywords: Scientific visualization, computer graphics, personal computer, World Wide Web, internet communications, weather simulation, numerical weather prediction 1. INTRODUCTION In the IS&T and SPIE 98 conference the author1 reported a study dealing with designing a data generation and visualization system either using personal computers or Unix workstations. At that time, it was concluded that:
The current research will investigate the possibility of future computing-visualization systems using non-commercial software systems built on popular computer platform--personal computer. 2. DATA VISUALIZATION SYSTEM DESIGN CONSIDERATIONS In a previous research1, the author indicated that it is important to design a visualization system with emphasis on the issues of performance, connectivity, and interactivity. We shall review these issues as follows. 2.1 Performance Computer user expectations have risen significantly regarding the system performances on most of the workstations and personal computers. Moreover, these performances have become critical for most of the visualization design systems. Previously, such performances could be achieved only with a system designed on a high-performance workstation using a propriety data visualization software system. However, in the last few years, mid-range and high-end personal computers became capable of having an acceptable execution performance. It will be shown later in this paper that VTK running on a personal computer is demonstrating adequate performances in speed and visual quality that previously were only available on some commercial system 2.2 Interactivity The current design calls for flexible as well as easy-to-use intuitive interfaces to be made available to the users. VTK has an available interactive environment that uses mouse operations for manipulating visual objects. Typical operations include: rotate, zoom, and translate. There are some other operations that can be achieved through key presses. 2.3 Connectivity Under internet connections, the requirements of visualization with connections to different kinds of operating systems and processing powers have to be reconsidered. This feature will probably become an important issue for the design of new visualization systems. VTK is available on UNIX and personal computer platforms, and is developed with a C++ source code. It has been packaged to be run on UNIX and PC platforms, and it has complete makefiles for installation. The applications that are written in C++, Tcl/Tk, and JAVA are portable. For example a Tcl/Tk-based application can be run on a PC or a UNIX workstation. VTK is very good for an inter-platform application development. 3. PERSONAL COMPUTER-BASED DATA VISUALIZATION SYSTEM OVERVIEW The current research concentrates on the VTK implementation on a personal computer. A similar system can be built on a UNIX workstation. The VTK system features are to be presented as follows: 3.1 Visualization Tool Kit Architecture Visualization Tool Kit (VTK) was developed by a GE research team2, and it is a public domain software system. It is freely available and can be downloaded from a web site. VTK uses C++ to build an executable that contains C++ class library. It can use Tcl/Tk or JAVA for building user applications, or it can be used as C++ only application developing system.VTK provides Tcl/Tk executable for the personal computer platform. Therefore, when VTK is installed initially on a PC, it will execute Tcl/Tk examples. However, makefiles are available to build C++ and JAVA based VTK by using Microsoft Visual C++ or Borland C++.VTK has abundant classes/objects that come with the system. Users can use available objects or can write their own. Objects for visualizing iso-surfaces, streamlines, vectors, voxels, etc are already available to users. The author used VTK version 1.0 to visualize meteorological data on a UNIX workstation in early 1997, and it was proven that VTK could provide basic data visualization needs.VTK uses visualization pipeline or visualization network to construct an application. A comprehensive overview of these process is available3. A simplified visualization pipeline is shown in Figure 1. It consists of Source, Filter, Mapper, and Display processes. The functions of these processes are:
Figure 1 VTK Visualization Pipeline The visualization pipeline can be applied regardless of the system having a wrapper environment (Tcl/Tk or JAVA) or none (C++ only). Two code examples in Figure 2 are functionally equivalent. They both produce an iso-surface and display it.The left-hand-side code is coded in Tcl and the right-hand-side code is coded in C++. Tcl code and C++ code may appear different. Tcl language syntax is the reverse of that of C++. However, after studying several code examples, a user can easily convert one code to the other. Those who are used to C++ Object-Oriented software development can appreciate VTK code because the code follows pretty much how an object is created by ::New() statements. There should also be Delete statements., but they are omitted here. These two code examples show how the window environmental setup and processes are executed as follows:
These code examples produce iso-surfaces as shown in Figures 3 and 4. The codes do not provide information such as how the object is rendered. They only show how to do the rendering. Users need not to bother with detailed information such as rendering algorithm or geometry extraction. This is a good example for an object-oriented program design. However, if a user is to develop his/her own algorithms, methods, or other procedures, VTK provides the complete source code. This kind of information is generally not available from a propriety data visualization system.
3.2 Execution Efficiency The author did investigate VTK when it became known two years ago. The VTK was implemented on an SGI workstation with Tcl/Tk user interface. It was meant for designing an interactive visualization system using a web-browser. At that time, the execution speed was acceptable for the SGI workstation. However, VTK was not quite ready for the personal computer platform.This year the new version of VTK 2.03 became available, and the author began to work on the personal computer platform. The VTK was implemented on a SONY laptop with 233 MHz CPU processing speed with 64 Mbytes memory. The processing speed and interactivity are quite acceptable. The newer version VTK 2.2 became available in November, 1998. It has many improvements over the previous version 2.0. The newest VTK running on the personal computer platform uses OpenGL, and it has interpreted wrapper languages Tck/Tk, JAVA, and perl. VTK is now a system with an execution efficiency that rivals commercial systems which are familiar to the author. 3.3 Quality of Visual Object The author did use SGI-based VTK to generate iso-surface and vector objects two years ago. The quality of these visual objects is acceptable. The rendering was done by OpenGL. Now, the author is using a personal computer version of VTK to generate visual objects. The quality of these visual objects is good. They are exemplified by printed graphics shown in Figures 3, 4, and 5. These visual objects are having the same quality of those generated by the commercial visualization system running on UNIX and PC platforms of comparable quality. VTK can also produce anti-alias high-quality graphics by generating files confirmed to Renderman format. 3.4 User Interactive Design of VTK VTK applications can be built with three types of design based on C++, Tck/Tk, and JAVA. VTK uses personal computer-based OpenGL as a provider of user interface. Basic interactive graphics movements such as rotate, translate, and zoom can be achieved by using first and second mouse buttons. There are some other keyboard controls that can be executed through keypresses such as e for exit, p for pick, r for reset camera, etc.3.5 Interpreted Wrapper for Building applications 3.5.1 Building Applications Using C++ This is the basic mode of VTK. There is no interpreted wrapper. To build an application, a user can write a C++ program calling available classes in the VTK class library. Users can also write programs to develop classes. In this research, most of the applications are developed in this mode so as to take advantage of the C++ environment. Batch processing can be built best with this mode. A code example has already been shown in Figure 2. 3.5.2 Building Applications Using Tcl/Tk This is the most common mode of using VTK. Interpreted command language Tcl is used to call VTK classes from the VTK class library. Tk is used to develop user interfaces like sliders. Many VTK examples shown in the VTK book3 are shown in this form. An application can be built easily with this mode. An application is developed by writing a Tcl program. The program can then be tested immediately without compiling. Some of the prototypes in this research were built with this mode.3.5.3 Building Applications Using JAVA This is the least developed mode of VTK. It is still under development by the VTK development team. For now, to build an application a user has to build a JAVA executable program by developing a JAVA class. When the application class is completed, it has to be compiled into a byte-code by using JAVA compiler javac. The compiled program can then be executed by a JAVA command java. The second way to build an application is to develop an applet in a JAVA source program. The applet has to be compiled by JAVA compiler javac to create an applet class. Then a webpage has to be built including this applet. The webpage can be executed by JAVA supplied processor appletviewer. The webpage can not be processed successfully with a web-browser for the current VTK release. 3.6 Building a Visualization Distribution System Using World Wide Web Technology VTK can produce VRML objects that can be viewed by a web-browser with the Cosmo Player plug-in. At the VTK website, an example is shown featuring a VRML server that can be built by using a webpage form and cgi script. The author has experimented with this VRML server in a UNIX Intranet environment, and it worked. Current research will investigate further with non-UNIX Internet environment. 4. DATA VISUALIZATION CASE STUDY 4.1 Data Preparation VTK uses VTK file format for data input. The format is a relatively simple file format that include:
The dataset used for this case study is a set of meteorological data generated by a numerical simulation model for a mesoscale storm system4. The author has used this dataset for previous studies5. It is a good dataset for comparing data visualization systems. The time-dependent data were generated. The data are then assigned to data points. Each point has a positional coordinate in three dimensions. For simplicity, in this research the geometry information is ignored, so the data are to be visualized with regular even-spaced grids. Also for analysis, only one time step data are used. The generated data are formatted with the VTK file format. The dataset consists of fields including: wind velocity, temperature, water vapor, cloud water, rainwater, and surface pressure. Except for the surface pressure data that is two-dimensional, all other data fields are three-dimensional data. 4.2 Execution Environment 4.2.1 C++ This is the simplest VTK system for building applications. The visualization pipeline (network) is coded directly into a C++ program as it is shown the C++ code example in Figure 2. The C++ program is then compiled and linked to C++ class library to build an application. Once the application is built, it can start executing by selecting the built application by a mouse, or it can start execution from MS-Dos command line. All graphics shown in this paper have been done with this C++ environment. It is quite simple to develop an application with the C++ environment. However, a user has to have a C++ compiler to build VTK applications. The application building is not interactive because it does not use interpreted language like Tcl/Tk. 4.2.2 Tcl/Tk In this research, some applications were built originally with Tcl/Tk environment. An application can be built quickly, and it does not require C++ compiling and link steps. Once a Tcl script is developed, it can be executed immediately. If a user is very familiar with Tcl language, he/she can develop an application at the Tcl console window. However, some advanced applications are hard to develop because they require batch or recursive operations. Some prototypes used in this research such as the iso-surface visualization code shown in Figure 2 were done with Tcl environment.
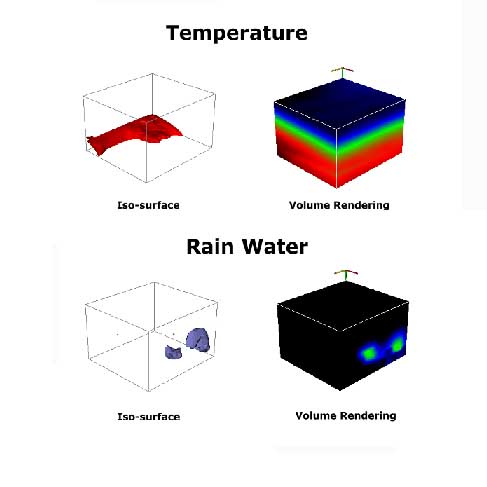
4.2.3 JAVA The JAVA VTK system is very similar to C++ VTK system. Languagewise, JAVA is very similar to C++ except JAVA has no pointers. A VTK application can be built with a user developed JAVA program: a JAVA class. If it is not a JAVA applet, it can be executed with JAVA executable java. If the application is an applet, the applet has to be incorporated into a webpage. The current VTK version can not execute the developed applet through a web-browser. The webpage has to be executed by the JAVA- supplied java appletviewer. This execution mode has not been used for the current research. 4.3 Visualization Elements Common visualization techniques such as iso-surface, volume rendering, vector display, etc. will be discussed as follows: 4.3.1 Iso-Surface and Volume Rendering Figure 3 shows objects produced by two different visualization techniques. The left column features objects produced by the iso-surface technique, and the right by the volume rendering technique.
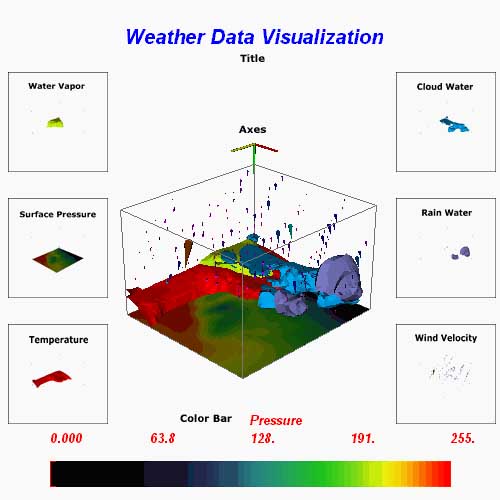
Figure 3 Comparing iso-surface and volume rendering technique The first example shows the superiority of the temperature iso-surface technique over the volume rendering, while the second example shows the superiority of the rainwater volume rendering technique because it depicts contoured rainwater field done automatically by this technique. The iso-surface technique requires less computations then the volume rendering technique, and it also uses less computer memory. Therefore, it is good for interactive analysis. The volume rendering technique requires more computer resources, and its display is not very interactive due to memory requirements. However, the volume-rendering technique gives more insight as shown in the rainwater example of Figure 3. In the present research no interactive contour value controls such as sliders are included in this research. VTK does provide a rich set of interactive tools such as a slide bar, buttons, etc. when using Tck/Tk environment. 4.3.2 Wind Vector Display In the present research, a simple vector display technique is used. It uses a glyph of a cone to show a wind vector. The wind magnitude is shown by the size of the glyph, and the direction of the wind is shown by the orientation of the glyph. If a user does not want to display all of the vectors, VTK uses a resolution parameter to specify the number of vectors to be omitted. This may work for vectors in a domain of all even number grid points in three dimensions. However, the present case has a dataset with mixed odd and even grids in three dimensions. Therefore, the vectors shown in Figure 3 have some diagonally distributed vectors in the displayed domain. This idiosyncrasy may be avoided if the wind vector is preprocessed with skipped points. The preprocessed wind vector field is then processed with all of the vectors with no extraordinary spacing problem. VTK provides other flow visualization techniques such as streamline and tensor analyses. These features will be considered for future research. 4.3.3 Annotation Text and Legend Previous VTK releases did not have any annotation text and legend, nor did the VTK did have two-dimensional actors available for displaying text and legend. However, VTK 2.2 has added these features. These two dimensional actors are not affected by camera or interactive operations. In other words, they can not be moved by mouse operations. They are convenient features. However, these two-dimensional actors can not be transferred to a VRML object. Examples of annotation text and legend are shown in Figure 4. 4.3.4 Scalar Color Bar Previous VTK releases did not have a scalar color bar to annotate colors associating with contoured values. VTK 2.2 has this new scalar color bar for annotation. This new class/object enhances VTK's display clarity. The scalar color bar that is used for showing pressure values is shown in Figure 4. These color values are corresponding to the colors used in the cut plane analysis shown as Surface Pressure in Figure 4. 4.3.5 Cut Plane Analysis VTK provides cut plane (slice) analysis, where a user can choose a location and an orientation for a cut plane to go through the data domain. On this cut plane data can be mapped to display contours and other visual objects. The example shown in Figure 5 is the surface pressure contour analysis that lies on the bottom of the data domain. The plane shows different color zones depicting different contour values as shown in the color bar in Figure 4. 4.3.6 Composite Analysis In the previous research5, the author used a commercial data visualization system and a UNIX workstation to construct a composite analysis by combining temperature, water vapor, cloud water, rainwater, pressure, and wind velocity fields on a single window. In this research, the composite technique is re-used to examine the capability of VTK on a PC to reproduce what was done on a UNIX workstation before. The result is very satisfactory. VTK can do the job just like a commercial data visualization system running on a UNIX workstation. The result is shown in Figure 4. It is also worth mentioning that VTK, just like any other visualization system, also provides visual aides such as axes, text, legend, and color bar.
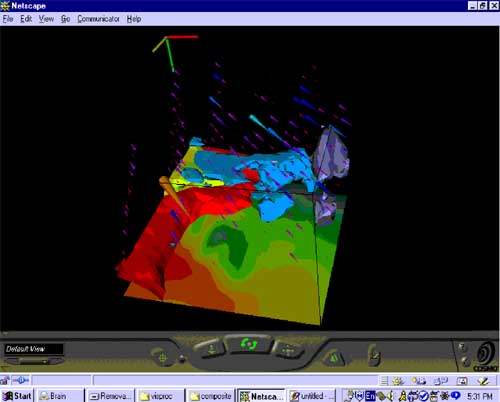
Figure 4 Composite Analyse The meteorological condition shown in Figure 4 has been discussed in the previous research5, and it will not to be repeated here. In short, Figure 4 shows a favorable condition for a long lasting storm. The temperature field shows a sloping warm front favorable for upsloping winds to bring moisture to the upper air, while water vapor and cloud water congregated in the right hand side are favorable for the formation of rain. This is a good case which a meteorologist can use in this composite analysis to explain a storm development. 4.4 Web Visualization The author's initial motivation was to use VTK for developing a web-based data visualization system. A prototype was built with an intranet system consisting of a UNIX web-server and several UNIX workstations and personal computers as clients. A webpage was constructed so that a user could log into the page and could assign parameters such as contour values, cut plane position, etc. These parameters were then fed into a web page form. By submitting this form, a visualization session started with a Common Gate Way Interface (cgi) command initiating and running a VTK program on the server. The server then sent a VRML object to the client. This object contained analysis items specified by the user.The prototype was a moderate success due to strict security imposed on internet routers. However, the lesson learned was that due to its open system design VTK would have a better chance to succeed than a commercial system. The author renewed his VTK interest this year. VTK is maturer than two years ago, and it still has a great potential for web visualization. 4.4.1 VRML Object VTK can output VRML objects. It can capture objects in a rendering window and produce VRML objects. All of the window and object attributes including lighting, object color, texture, and geometry are preserved. A VTK produced VRML object can be viewed by a web-browser with the VRML plug-in: Cosmo Player. An example webpage is shown in Figure 5, where all objects produced by composite analysis shown in the previous section are present except for two-dimensional objects: scalar color bar; annotated text; and legend. Interactivity of Cosmo Player is very good. There are built-in gadgets for zoom, pan, and rotate.
Figure 5 Composite Visualization of VTK exported VRML object 4.4.2 Designing a web visualization system We may follow what has been achieved in the previous study; however, a lot more can be done with the present VTK system. VTK can also output image files with formats like bmp, tiff and other popular ones. For a time-dependent dataset like weather data, it may be practical to generate a sequence of image files that can be played by a JAVA image animation applet upon a user's request. For such an application to handle VRML objects may require a large bandwidth system that may not be available to the general public. To animate time-dependent VRML objects is another technical challenge yet to be solved by the VRML community. At the present moment, one can only explore and contemplate the possibility of how to build a fully interactive, realtime web visualization system. 5. FUTURE WORK AND FUTURE TRENDS 5.1 Future Work The current research is a starting point for the future work. Several among the interests that are to be considered for future accomplishment are: 5.1.1 Develop a JAVA-based data visualization system The current research did not include JAVA-based data visualization system. This is partially due to lack of time and VTK's JAVA environment which is still under development. JAVA is an important vehicle for future web-based visualization, and JAVA could also become one of the most important future programming languages. 5.1.2 Experiment with streamline vector visualization VTK has a very good streamline visualization tool. It will be interesting to see how streamline works with the meteorological data. It would also be interesting to see how to extend streamline tool for time-dependent display applications. 5.1.3 Time animation of fields using VTK generated image files VTK was initially developed for static (non-time-dependent) visualization. For time-dependent application such as meteorological application, a time dependence may be visualized by generating sequence of image files. 5.1.4 Time animation of fields using VTK generated VRML objects VTK can generate VRML objects. It may be possible to generate a sequence of VRML objects for time-dependent applications. It might combine VRML and JAVA technologies to view such time-dependent objects. 5.2 Future Trends The first edition of the VTK book was published in 1995. It has been nearly four years since VTK became well known. VTK has been installed in almost all of the popular computer platforms with different operating systems: UNIX, Windows, and LINUX. Despite its popularity it has remained a public domain software system. VTK is an affordable system that works on personal computers. This is one of the reasons why it attracts a large number of users.VTK was originally designed for medical applications. It has many good features for dealing with medical visualization such as CT scanning data. However, it has become a multi-discipline system because of its open architecture and contributions of codes from the users. VTK has a very effective forum, a news group, where users can exchange and discuss issues. This is probably the reason why VTK is ever expanding. VTK is a community software system, like the Community Climate Model of National Center for Atmospheric Research, where the core system has been developing by a core of professionals and users have been contributing to enrich the system. Looking around the computation world after the introduction of world wide web, it is obvious that we are surrounded by high-quality, low-cost or no-cost software systems. Scientific visualization may have to follow the general trend of the rest of computation world. VTK is an indicator, a low cost or no-cost high-quality visualization system that is flourishing. 6 CONCLUSIONS The current research shows a promising public domain data visualization software system running on the personal computer platform. It is not only a free software, but also a very complete system allowing for expansion. In short, the current research yields the following conclusions:
ACKNOWLEDGEMENT Future, Inc. funded this research. The author implemented VTK 2.2 and developed the meteorological visualization software. The MM5 data source is NCAR. The paper was proofread by Silvia-Hauri Chen. REFERENCES 1. P. C. Chen, "A Personal Computer-Based Visualization System for Use in the World Wide Web Environment." Proceedings: SPIE, Visual Data Exploration and Analysis V. San Jose, California, 1998. 2. W. J. Schroeder, K. M. Martin, W. E. Lorensen, "The Design and Implementation of an Object-Oriented Toolkit for 3D Graphics and Visualization." Proceedings IEEE Visualization '96, San Francisco, October 1996. 3. W. J. Schroeder, K. M. Martin, W. E. Lorensen, "The Visualization Tool Kit-an Object-Oriented Approach to 3D Graphics." Second Edition, Prentice Hall PTR, Upper Saddle River, New Jersey, 1998. 4. G. A. Grell, J. Duhia, D. R. Stauffer, "A Description of the Fifth-Generation PENN STATE/NCAR Mesoscale Model (MM5)," NCAR Technical Note, NCAR/TN-398+IA, October 1993. 5. Climate and weather simulations and data visualization using a supercomputer, workstations and microcomputers." Proceedings: SPIE, Visual Data Exploration and Analysis II, San Jose, California, 1996. |
|||||||||||||